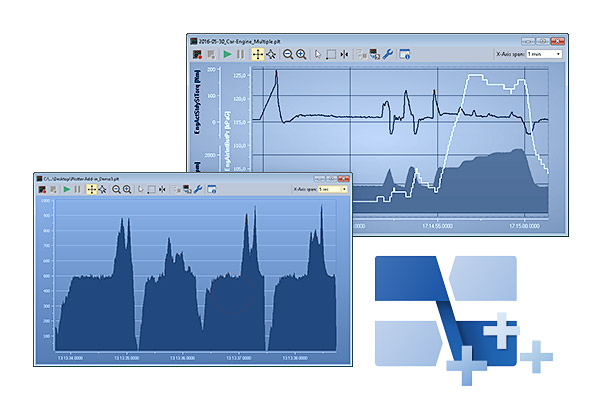
The Plotter Add-in allows the recording and graphical representation of any number of signal courses. Signal sources can be the data from incoming and outgoing CAN messages as well as virtual variables and results from macro calculations.
Shopping Cart


